Mumbai Property Price Index
Track two decades of per-sqft rate growth — built from 1,200+ tracked projects & MPE’s own listings archive since 2005.
Median quoted sale rate, rupees per sq ft · series 2005–2026 · updated October 2026 · open data (JSON)
📊 Analytics Engine
Value Appreciation Curve
Smoothed via MPE moving averageMumbai rates per sq ft, 2005 to 2026
Median quoted residential sale rate, rupees per square foot. Updated October 2026. Full series for 77 localities is available free via the JSON API.
| Locality | 2005 | 2010 | 2015 | 2020 | 2026 | Growth | CAGR |
|---|---|---|---|---|---|---|---|
| Powai | ₹3,111 | ₹9,494 | ₹15,318 | ₹21,142 | ₹29,591 | 9.5× | 11.3% |
| Thane West | ₹2,100 | ₹7,624 | ₹14,641 | ₹21,658 | ₹19,434 | 9.3× | 11.2% |
| Bandra West | ₹7,500 | ₹22,527 | ₹33,405 | ₹44,284 | ₹59,493 | 7.9× | 10.4% |
| Andheri West | ₹5,000 | ₹11,555 | ₹18,314 | ₹25,073 | ₹36,971 | 7.4× | 10.0% |
| Worli | ₹10,000 | ₹22,933 | ₹31,156 | ₹39,379 | ₹62,657 | 6.3× | 9.1% |
🧮 CAGR Returns Calculator
Historical compounding returns based on real listing & transaction history.
Powai
Median quoted rate rose from ₹3,111 to ₹29,591 per sq ft between 2005 and 2026.
Worli
Mumbai’s priciest micro-market in this index, at ₹62,657 per sq ft in 2026.
Frequently asked questions
What is the Mumbai Property Price Index?
It tracks the median quoted residential sale rate, in rupees per square foot, for 77 Mumbai localities for every year from 2005 to 2026, compiled from Mumbai Property Exchange records.
Which Mumbai locality has appreciated the most since 2005?
Powai. Its median quoted rate rose from Rs 3,111 per sqft in 2005 to Rs 29,591 in 2026 — 9.5 times over 21 years, about 11.3% a year.
Did Mumbai’s most expensive localities grow the fastest?
No. Over this period Powai grew 9.5 times while Worli grew 6.3 times, so the lower-priced suburb outpaced the premium micro-market on growth multiple even though its absolute rate stays far lower.
Where does this price data come from?
Mumbai Property Exchange records only: dated per-project quoted rate histories for 2005 to 2007, MPE locality rate snapshots for intermediate years, and the MPE listings archive from 2022 onward. Years between real data points are linearly interpolated and carry a sample count of zero. These are quoted and listed asking rates, not registered transaction values.
Can I use this data?
Yes. The full series is available free as JSON at /api/price-index-data, and the list of covered localities at /api/price-index-locations. Please cite Mumbai Property Exchange as the source.
The Authority on Mumbai Real Estate Pricing — Tracking Rates Since 2005
Unlike portals that rely on ad-hoc seller estimates, this index is built only from Mumbai Property Exchange’s own records going back to 2005: dated per-project quoted rates from the 2005–2007 era, MPE locality rate snapshots through the intervening years, and the MPE listings archive from 2022 onward. It reports the median quoted and listed asking rate per square foot — not registered transaction values — and interpolates only between real data points, never beyond them.
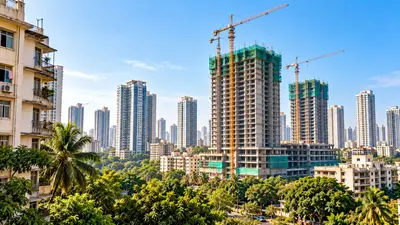
Infrastructure additions remain the primary drivers of premium returns in Mumbai. Over two decades, Worli, Bandra West and Powai have grown from developing sub-markets into high-value investment destinations. Under-construction properties in these regions yield premium growth, especially in the pre-launch and early-construction stages.
Whether you are evaluating a 2 BHK in Andheri West or a luxury high-rise on Nepean Sea Road, understanding long-term historical compounding returns is critical for hedging inflation and securing prime yields.